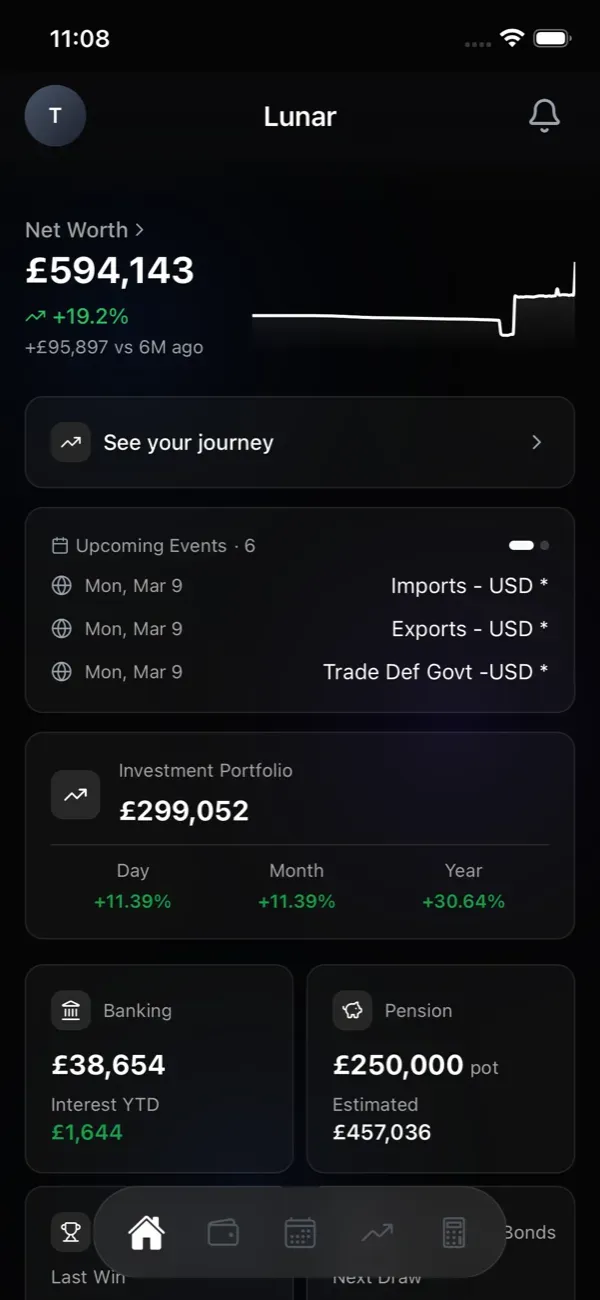
Track your wealth in one app
Investments, pensions, and savings — see real returns vs inflation at a glance. Track investments, pensions, and retirement accounts with real-time performance metrics. Monitor your complete wealth dashboard and know exactly how your money is growing vs inflation.
Your money is everywhere
Different apps. Different portals. Different logins.
No idea if you're winning
Are your investments beating inflation? No single app can tell you.
Spreadsheets can't keep up
Manual tracking that's always out of date the moment you save it.
Lunar connects everything
Banks, brokers, pensions, and savings - one view of your complete wealth.
Banks
Stocks
Crypto
Pensions
Bonds
Grants
ISAs
Savings
Cross-Account Aggregation
Own the same stock in multiple accounts? See unified performance, total holdings, and combined history for any ticker across all your brokers.
Account History
Every trade, dividend, and transaction in one timeline.
Ticker Performance
Drill into individual stock buy/sell history and returns.
Smart Manual Portfolio
Auto dividend calculations, split accounting, and income tracking for manually added holdings.
Your trading accounts connected
Connect your Trading 212 Invest and Stocks ISA accounts for automatic portfolio syncing, or add any broker manually with smart dividend tracking.
*Live portfolio and live prices subject to API rate limits
Financial Data
Revenue, earnings, margins, and key financial metrics across reporting periods.
Insider Activity
Track director and executive buy/sell transactions as they happen.
Ownership
Institutional, insider, and retail ownership at a glance.
Short Interest
Monitor short selling activity and changes in short interest over time.
Analyst Signals
Consensus ratings, price targets, and recommendation trends from analysts.
Research any company in depth
Tap into any stock in your portfolio and get a full company profile - financials, insider activity, ownership breakdown, and analyst signals all in one place.
Scheme Details
Understand your scheme rules, holding periods, and any tax advantages that apply to your grants.
Grant Overview
All your stock grants in one place - RSUs, options, and share schemes with grant dates and quantities.
Current Value
Live valuation of vested and unvested shares based on the latest market price.
Company stock grants tracked
Whether it's RSUs or share options - track your vesting schedule, current value, and tax position all in one place.
NS&I premium bonds performance
Track your NS&I premium bonds prize history and see how your actual winnings compare to the advertised odds.
Graphics for demonstration purposes. Design may defer in app.
Cumulative Prize Winnings
Understand financial terms & metrics
Tap any i in the app to see a plain-English explanation.
P/E Ratio
How much investors pay per £1 of company earnings. A quick way to judge if a stock looks expensive or cheap relative to its profits.
e.g. Price £185 ÷ EPS £10 = 18.5× — under 15 is cheap, over 25 is expensive
PEG Ratio
PEG adjusts the P/E by the company's earnings growth rate. It helps you spot if a high P/E is justified by fast growth, or if a stock is genuinely overpriced.
e.g. P/E 18.5 ÷ 15% growth = 1.2× — below 1.0 is undervalued, above 2.0 may be overpriced
Market Cap
The total value of all a company's shares. Tells you the size of a company at a glance — small cap, mid cap, or large cap.
e.g. 497M shares × £185 = £92B — under £2B = small cap, over £10B = large cap
ISA
A tax-free savings and investment account for UK residents. You pay no tax on any gains, dividends, or interest earned inside one.
e.g. £20,000 annual allowance — use it or lose it each tax year
ETF
A fund that holds a basket of stocks and trades on an exchange like a single share. An easy way to invest in an entire market or sector at once.
e.g. Buy one S&P 500 ETF share and you own a slice of 500 companies
Dividend Yield
The annual income you receive from a stock as a percentage of its price. Your passive income rate from holding shares.
e.g. £840 income ÷ £20,000 invested = 4.2% — 2–4% is typical, above 6% warrants a closer look
Scroll to explore terms
These are just a few examples — more explained in the app.
Never miss what matters
Stay ahead with a personalised calendar of events relevant to your portfolio — earnings calls, dividend dates, BoE decisions, and market-moving announcements.
Base Rate Decision
Thu, Feb 6
Result: 4.50% (Prev: 4.75%)
Ex-Div: $0.01 per share
Wed, Mar 4
Est. £0.41 (51 shares)
Premium Bonds Draw
Thu, Apr 2
UK Tax Year End
Sat, Apr 5
Ex-Div: $0.26 per share
Mon, May 11
Est. £35.36 (170 shares)
Ex-Div: $0.91 per share
Fri, May 22
Est. £7.28 (10 shares)
Q1 2025 Results
Thu, Jul 15
EPS Est. $2.12
Allowances to taxes at a glance
Track your allowances and see exactly how much tax you owe when you exceed them.
Graphics for demonstration purposes. Design may defer in app.
Retirement income calculator
Stress-test your retirement with UK tax bands, state pension, and optimal withdrawal strategy.
Pension Pots
Pot Total · £280,500Workplace Pot
Pot
£186,000
Vanguard SIPP
SIPP
£94,500
Income sources
£12,702/yrState Pension
Guaranteed income
£11,502/yr
Savings interest
Annual
£820/yr
Dividend income
Est. annual
£380/yr
Starting values, assuming savings is untouched
Graphics for demonstration purposes. Design may defer in app.
Withdrawal Plan
Age 81 breakdown
Plan
1 yr
Aggressive
Age 81 breakdown
Net Income
Target £34k / yearFirst year
£71k
Median
£13k
Final year
£14k
Pot at 90
£0
Retirement plan
Age 67 → 90 · 23 yrs
Total tax
£52k
Built for UK investors
Track your ISAs, pensions, Premium Bonds, and capital gains within the UK tax year. Monitor your dividend and savings allowances, and stay on top of HMRC deadlines. Built entirely around how UK investors manage their money.
Expanding to other countries soon
Your entire investment history
Every trade, every dividend, every market crash and rally - traced back to day one. Lunar stitches together your complete financial story across every account you've ever held.
Chart Replay
An animated replay of your entire portfolio value from account creation to today. Key moments highlighted as the line passes them.
Total Return
Your overall performance across every account, from the day you started investing.
Best Performer
The holding that carried your portfolio this year.
Worst Performer
The one that dragged it down. No hiding from the full picture.
Dividends Earned
Every payout tallied across your entire portfolio.
Contributions vs Growth
How much you saved vs how much the market gave you. See the power of compounding.
Monthly Breakdown
Which months were green, which were red. Spot the patterns in your financial year.
Benchmark Comparison
How you compared to the S&P 500, FTSE 100, and inflation.
Wealth Percentile
Your net worth compared to national financial surveys, broken down by age group.
And more...
See all your wealth in one app
Join the waitlist for early access to the app that brings all your UK investments together on web, iOS, and Android.